User Flow Analytics Reports
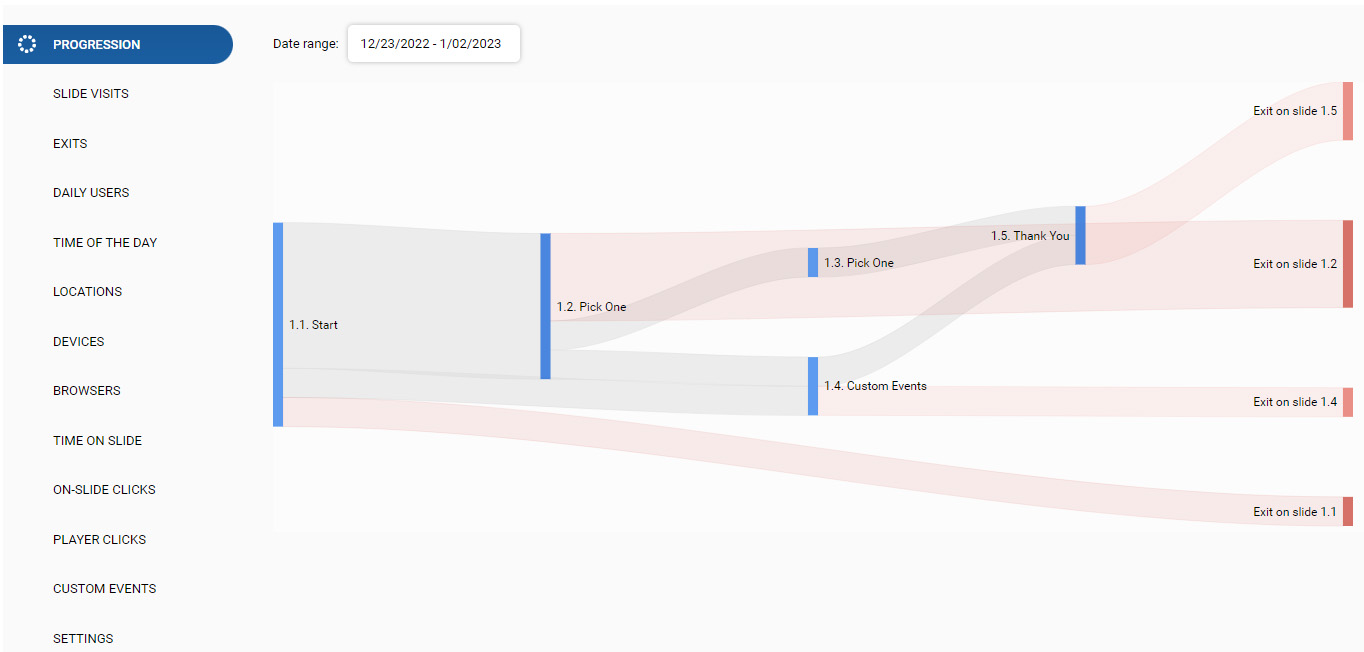
Progression Report
Shows how users progress through the slides in the online course, as well as which slides serve as the entry and exit points in the course.
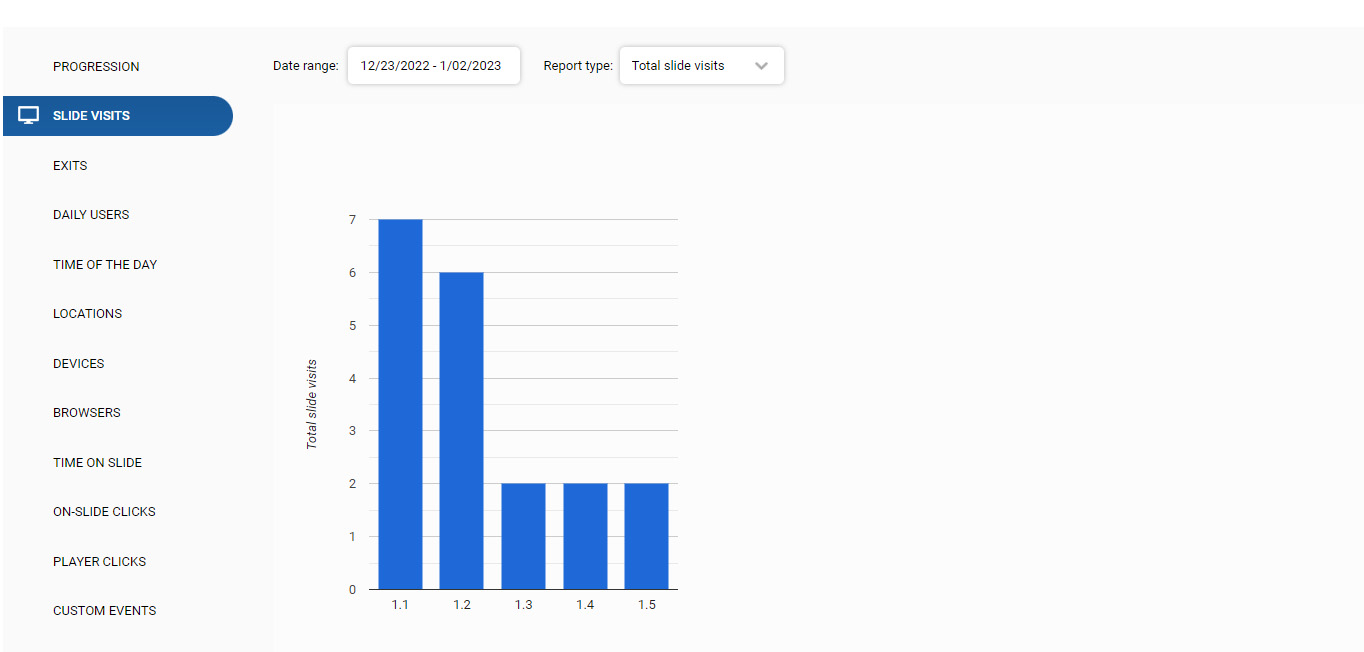
Side Visits Report
Provides information on how many times each slide in an elearning course has been visited by learners. This type of report can be useful for evaluating the effectiveness of a course, as it can provide insights into which parts of the course are most engaging and which are less so. The report might show, for example, which slides have high visit counts and which have low visit counts.
The report can show absolute visit counts as well as average visits per user.
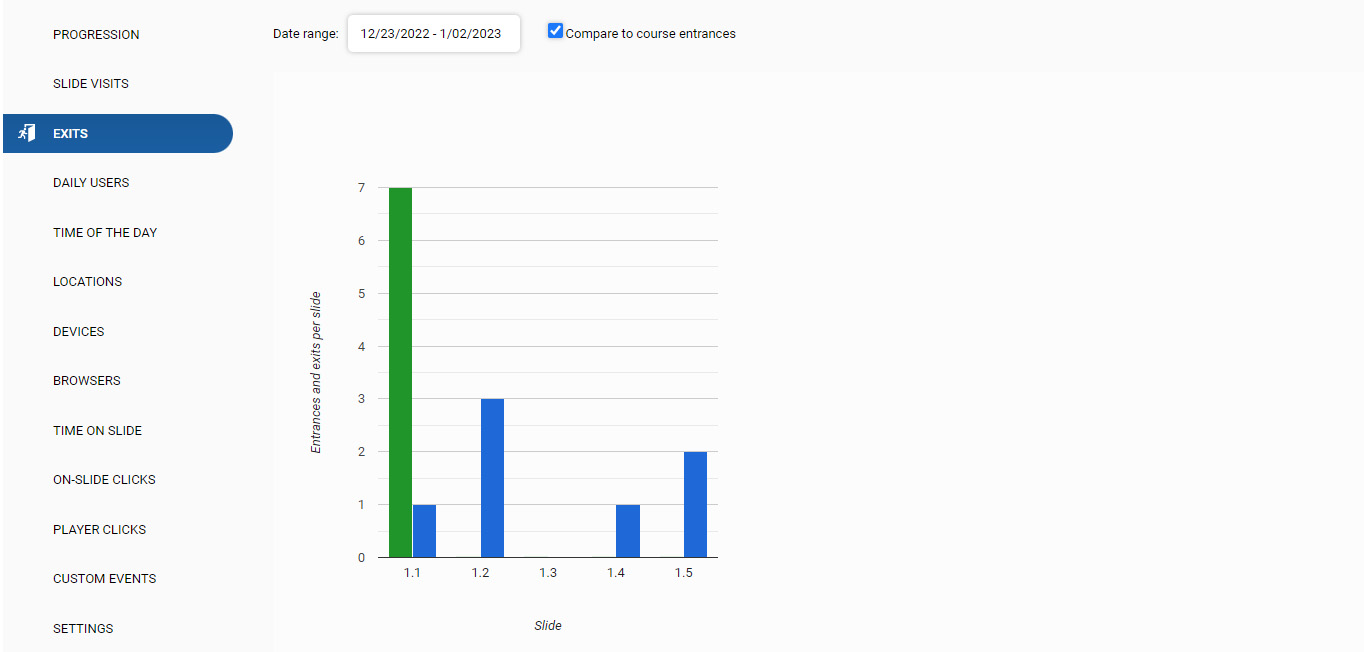
Exits Report
Provides information on when learners exit an elearning course. This type of report can be useful for understanding why learners may be leaving a course and for identifying any potential problems or areas of improvement.
The Exits report might provide insights, for example, if learners abandon the course at specific points such as after a particular topic or quiz. It may help you understand the reasons why learners are exiting the course. This information can be used to identify areas of the course that may need improvement or to identify patterns in the data that can help explain why learners are exiting the course.
This report also allows comparing entrances and exits per slide.
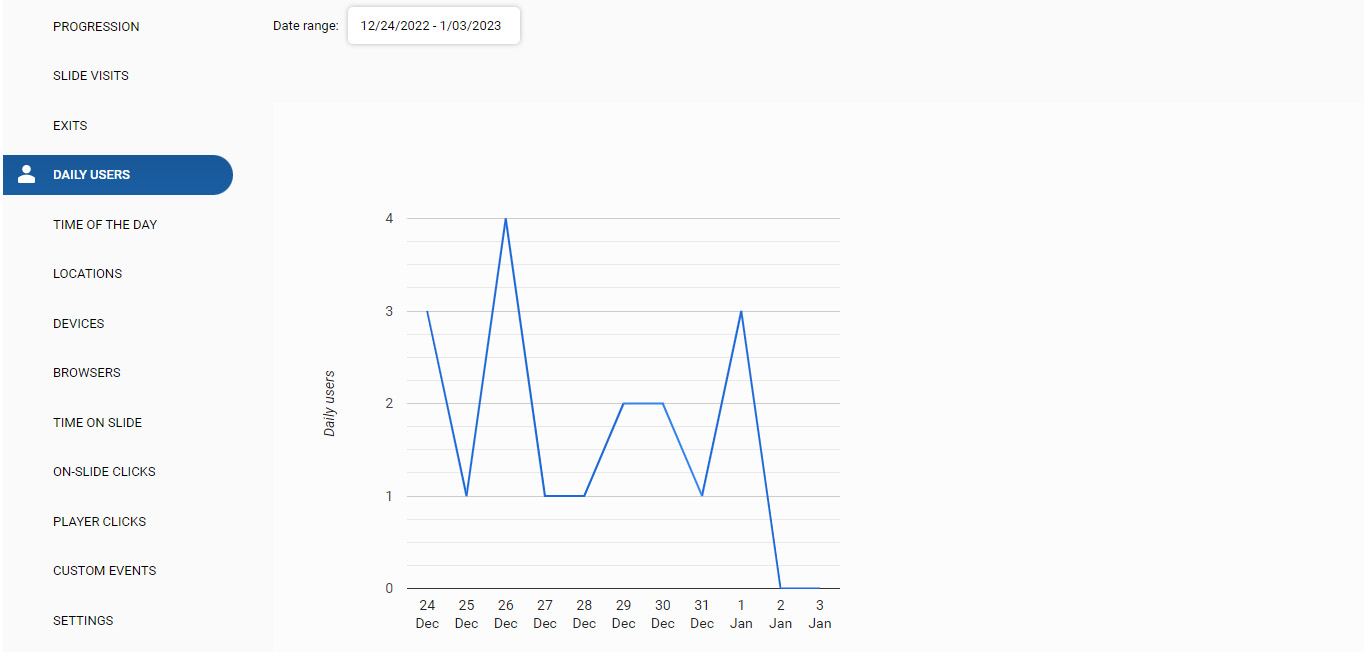
Daily Users Report
Provides information on the number of learners who access an elearning course daily. This type of report can be useful for understanding how many learners are using the course on a regular basis and for identifying any trends or patterns in usage over time.
It might also be helpful to compare the percentage of learners who complete the course each day or who exit the course at specific points to the total number of daily users. This information can be used to identify trends in usage over time.
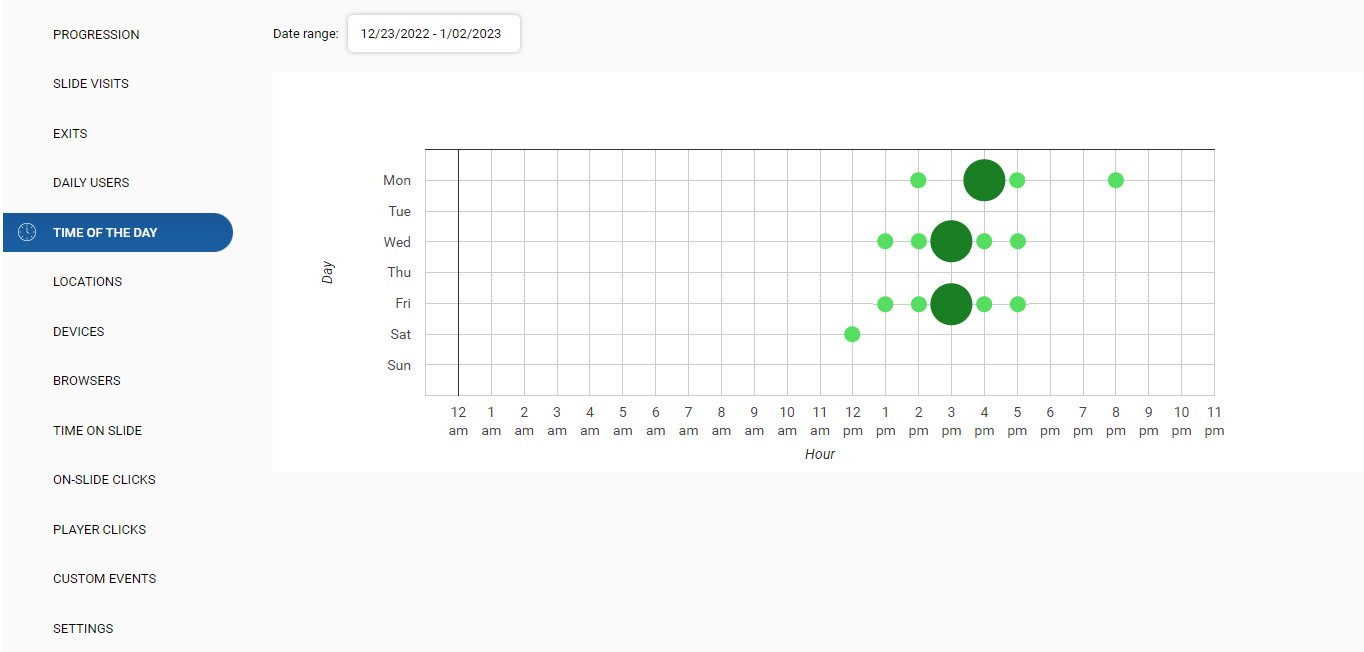
Time of the Day Report
Provides information on times when learners access an elearning course broken down by day of the week and hour of the day. This type of report can be useful for understanding what days of the week and hours are the most active times for learning.
This information can be used to identify trends in usage over time and to understand when learners are most active.
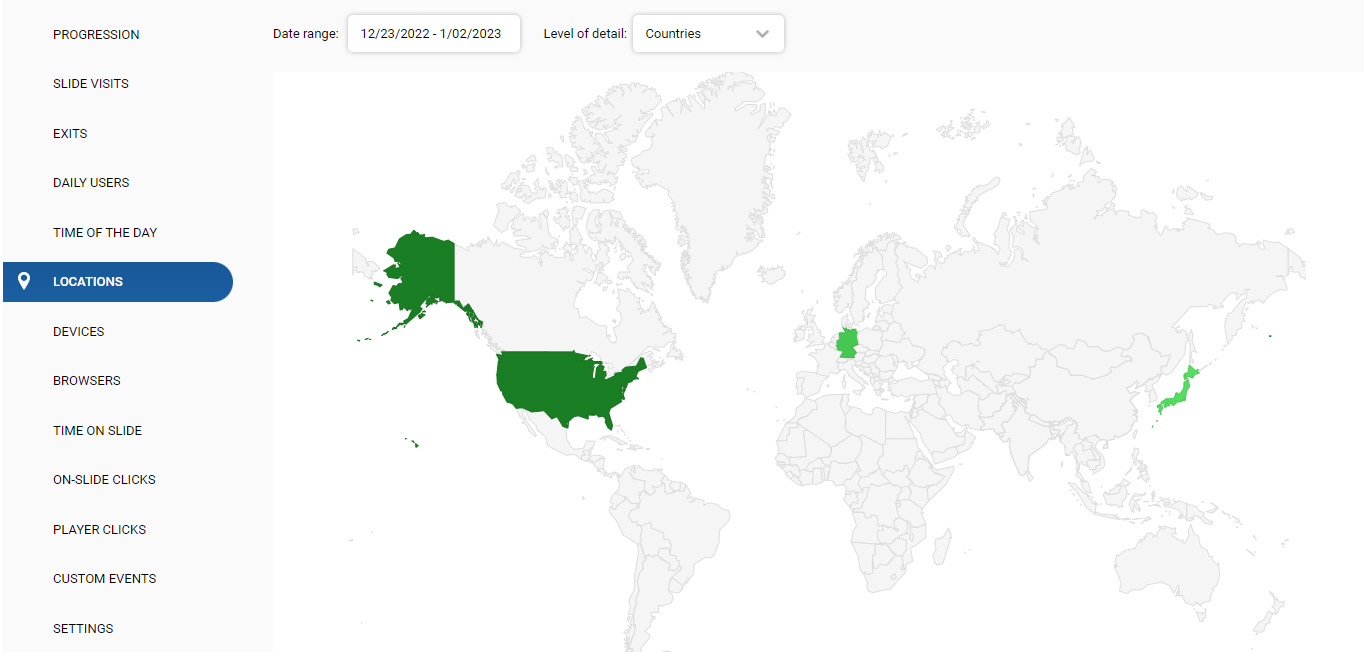
Locations Report
Provides information on the location of learners who access an elearning course. It might show, for example, the number of unique learners who access the course from different countries or regions. This information can be used to identify trends in usage by location and to understand where learners are located.
The information can be grouped by city or town, by region or state, and by country.
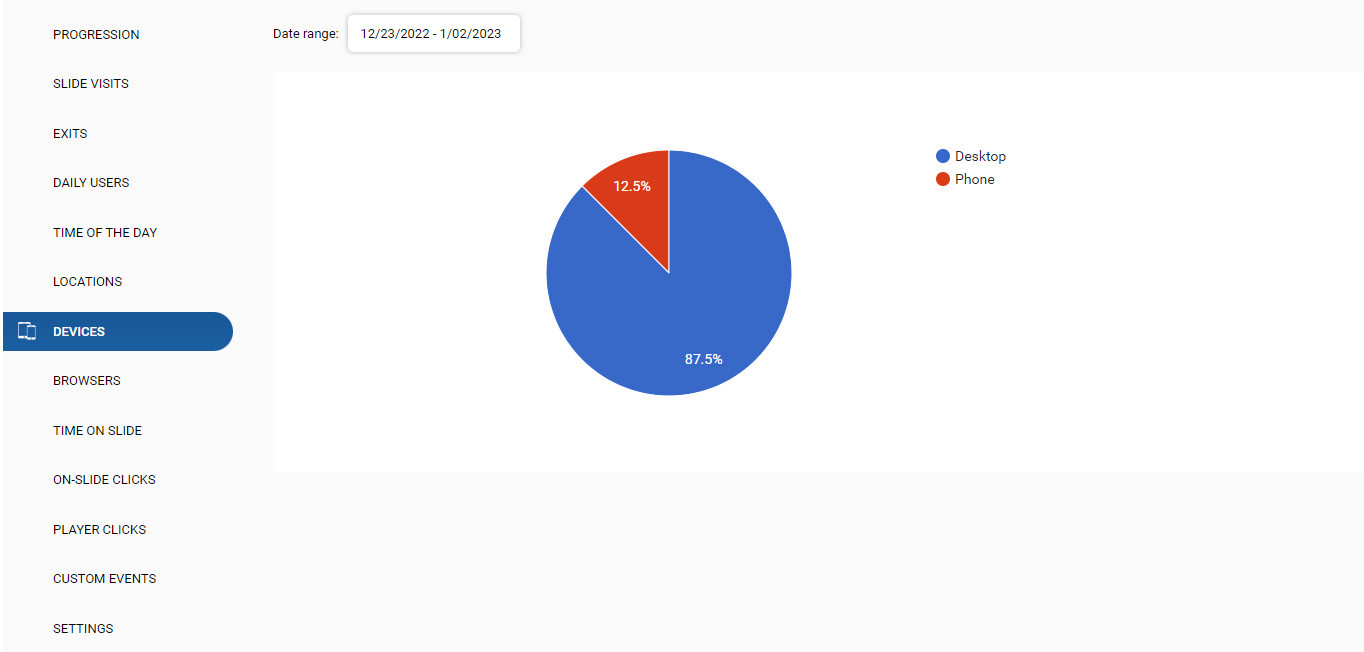
User Devices Report
Provides information on the types of devices that learners use to access an elearning course. This information can be used to identify trends in usage by device type and to understand which types of devices learners are using.
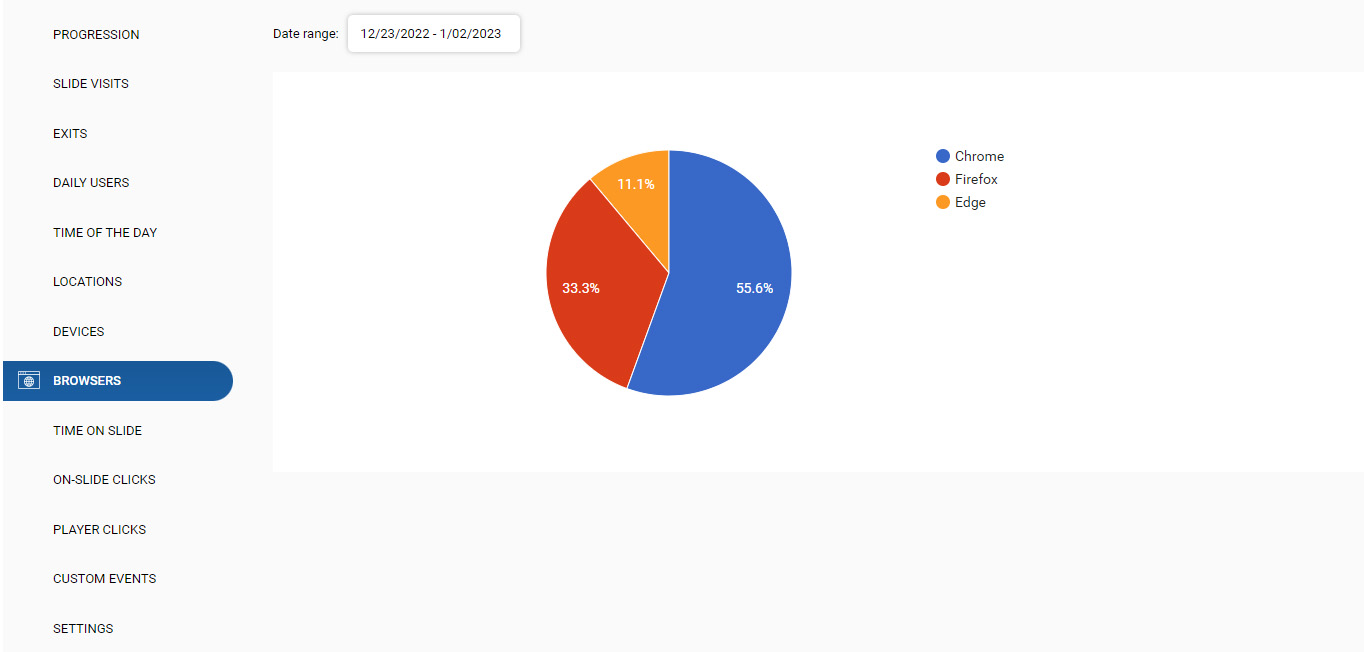
Internet Browsers Report
Provides information on internet browsers that learners use to access an elearning course. The elearning user internet browsers report might show, for example, the percentage of learners who access the course from different internet browsers (such as Google Chrome, Firefox, Safari, or Edge).
This information can be used to identify trends in usage by browser type and to understand which types of internet browsers learners are using.
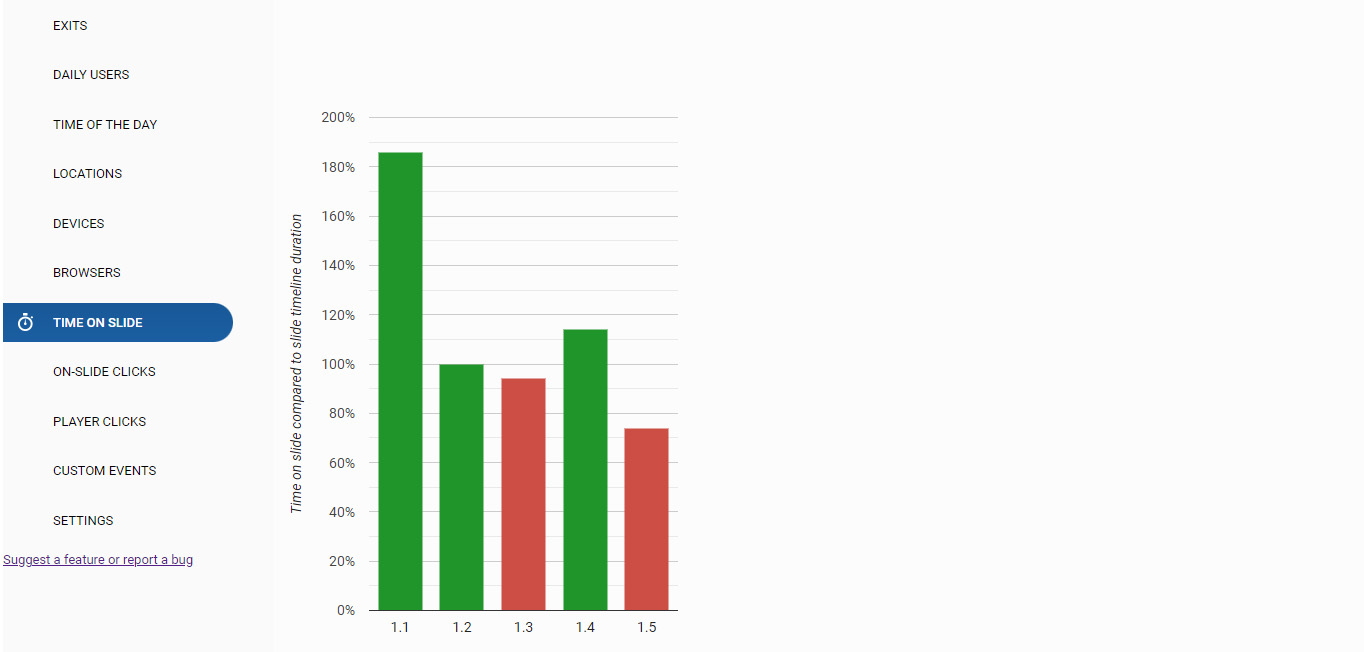
Time on Slide Report
Provides information on how much time learners spend on each slide in an elearning course. This type of report can be useful for understanding which parts of the course are most engaging and which are less so, and for identifying any areas of the course that may need improvement.
The elearning Time on Slide report might show the average time spent on each slide by the learners or the percentage of the total slide timeline duration. This information can be used to identify areas of the course that may need improvement or to highlight areas that are particularly effective.
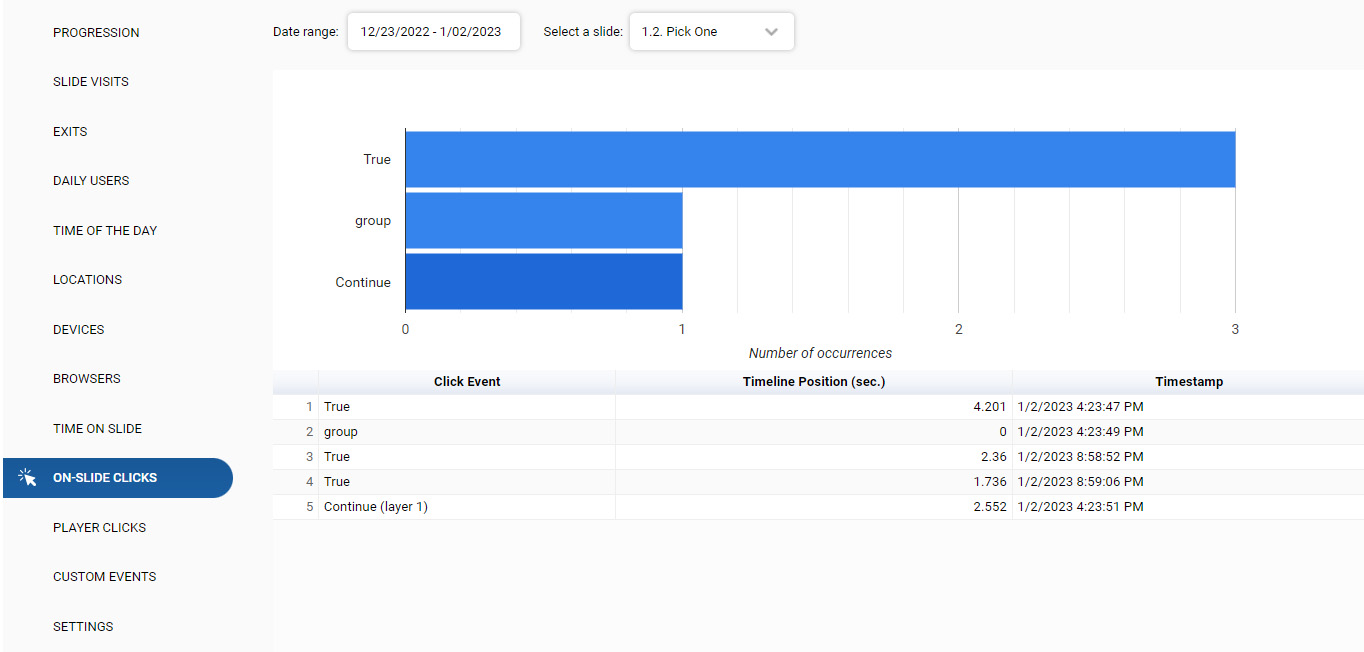
Slide Clicks Report
Provides information on the events (clicks) that occur on each slide in an elearning course. This type of report can be useful for understanding how learners interact with the course and for identifying any areas of the course that may need improvement.
The elearning Slide Clicks report might show, for example, the number of times each event (such as clicking a link) occurred on each slide.
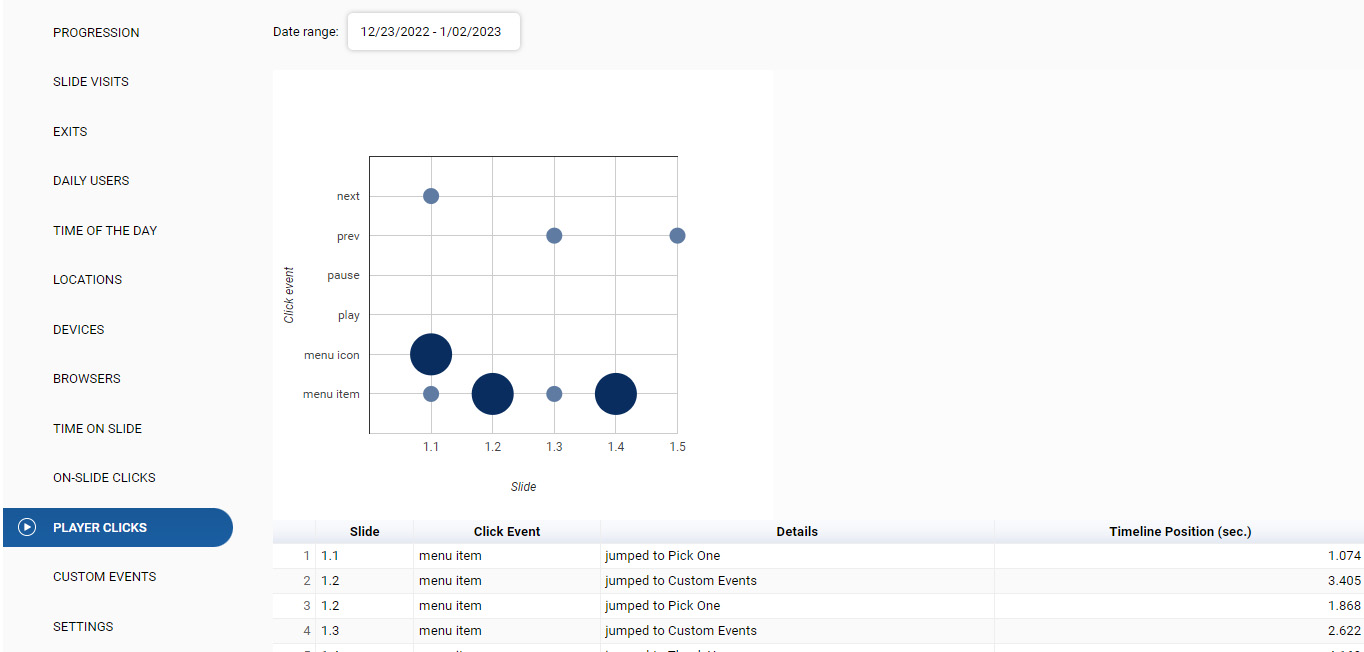
Player Clicks Report
Provides information on the player clicks that learners make while interacting with an elearning course. This type of report can be useful for understanding how learners are using the player to interact with the course content.
The elearning Player Clicks report might show, for example, the number of clicks on the Next and Previous buttons, the number of users who paused or resumed the playback, users who clicked the navigational menu or resources, users who adjusted the volume, users who dragged the progress bar scrubber to skip to another section of the content, etc.
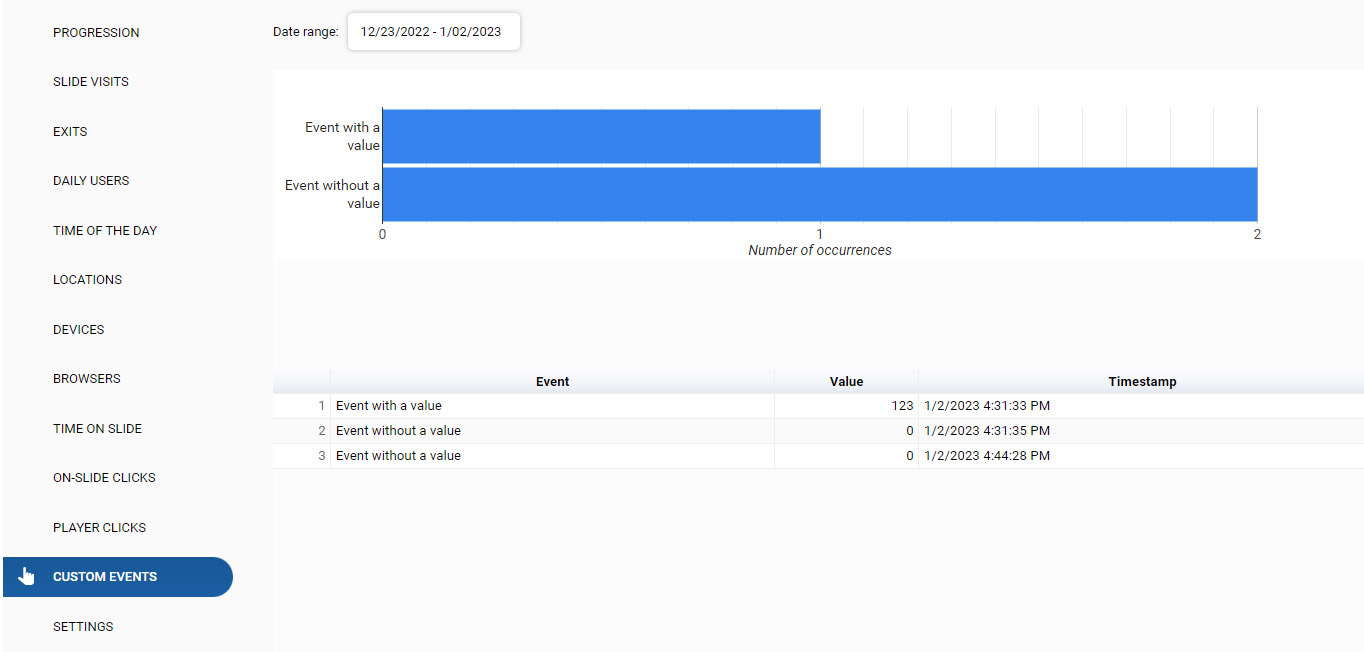
Custom Events Report
Provides information on custom events in an elearning course.
To record a custom event with a numeric value, execute the following JavaScript code:
userflowEvent('Event Name', 123);
where Event Name is a unique name of the event and 123 is the assigned value.
To record a custom event without a value, execute the following JavaScript code:
userflowEvent('Another Event');
where Another Event is a unique name of the event.